%205_11_27%20p_%20m__edited.png)

Qué hacemos:
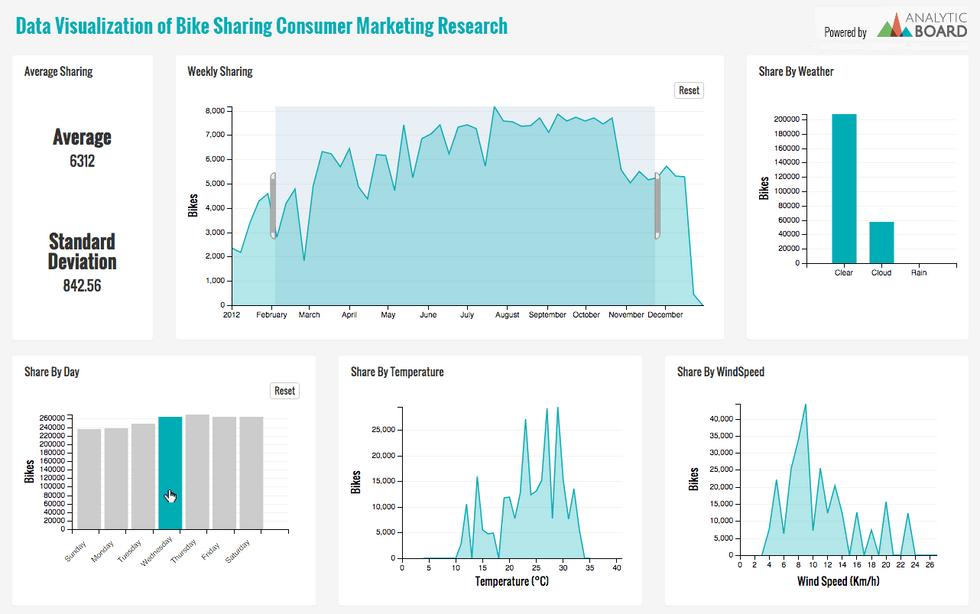
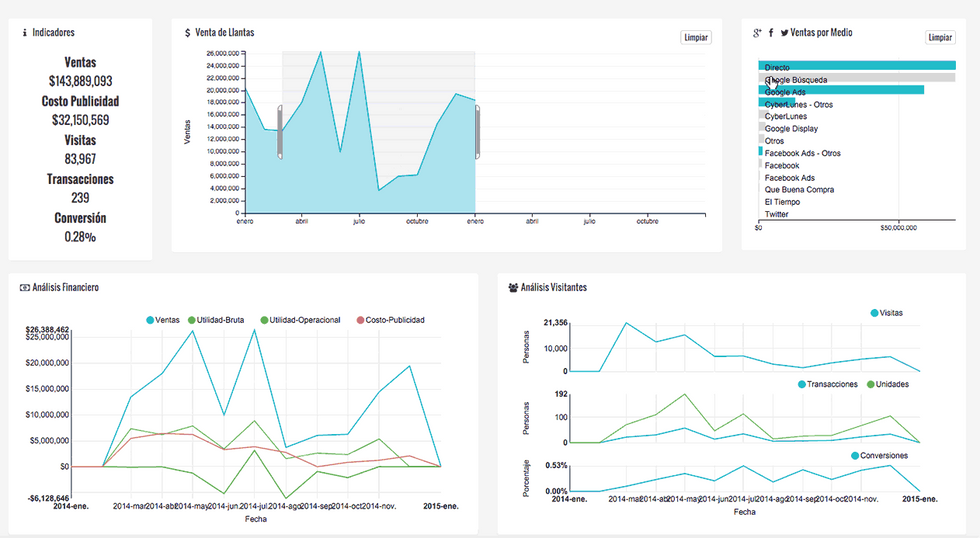
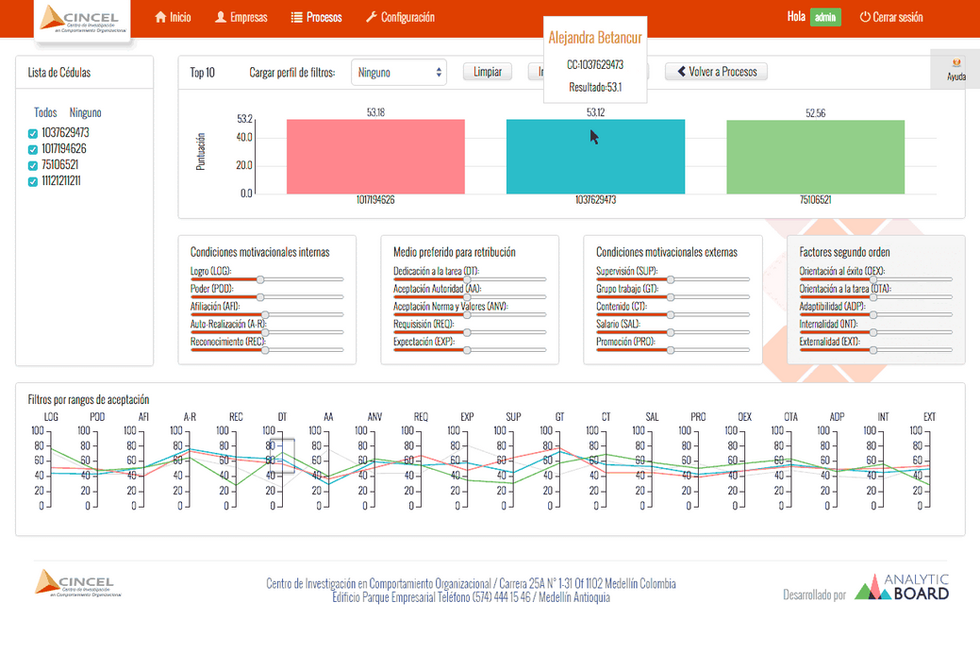
Creamos y diseñamos la mejor manera de visualizar y comunicar el valor que tienen los datos, no basta con tener datos, con extraerlos, con analizarlos. El verdadero valor de los datos se genera cuando los usuarios de negocios accionan, es aquí donde la visualización de datos cierra la brecha entre los datos (Estadística, matemáticas, software) y las decisiones de negocio y es aquí donde hacemos nuestro trabajo.

Implementación de Dashboard
Diseño de Dashboard
Diseño de Dashboard

Encontramos la mejor forma de presentar los datos y la información que responde a necesidades específicas del negocio, a través de metodologías de co-creación con el cliente. Este proceso se compone de:
-
Mapa de decisions
-
Diseño de visualización en papel.
-
Mockups y descripción de escenarios e interacciones
-
Informe de Hallazgos Datos
-
Informe Calidad de datos
-
Recomendaciones procesos y recolección de datos
-
Recomendaciones de visualizadores
-
Recomendaciones de capacitación


ALGUNOS DE NUESTROS PROYECTOS


